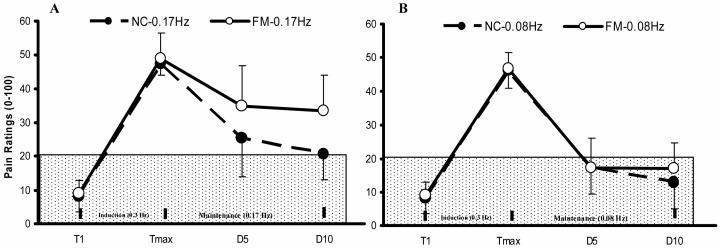
Figure 2.
Mean ratings (SD) of TSSP and TSSP-M of NC and FM subjects at the feet. After maximal TSSP pain ratings of 50 NPS units were achieved (Induction) the subjects underwent TSSP-M testing with 10 heat stimuli at 0.17 Hz (Panel A) and 0.08 Hz (Panel B) in counterbalanced order (Maintenance). The ratings of TSSP-M tap 1, 5, and 10 are shown. Stimuli at 0.17 Hz resulted in greater experimental pain ratings compared to 0.08 Hz in NC and FMS subjects (p = .01). (T = heat tap; TSSP = temporal summation of second pain; TSSP-M = TSSP maintenance; Tmax = maximal heat pain ratings during the last TSSP stimulus).

