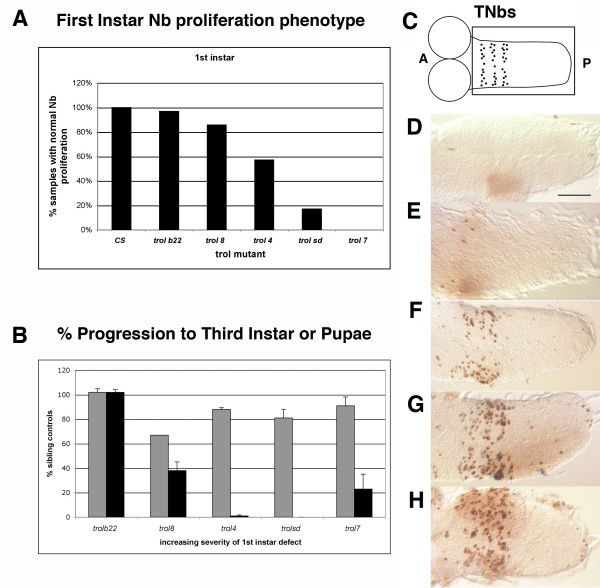
Figure 1.
Phenotypic series of trol alleles. A) First instar neuroblast proliferation phenotype presented as % of samples with numbers of BrdU labeled neuroblasts falling within the control range, some data originally published in Park et al, 2003a. B) Lethal phase phenotype presented as the percentage of trol mutant animals capable of survival and development to third instar (grey bars) or to pupal formation (black bars) compared to sibling controls. Error bars indicate s.e.m. C) Cartoon of second instar larval brain with dividing TNBs in ventral ganglion. Boxed area indicates portion of brain shown in panels D-G below. A = anterior, P = posterior. D-G) Examples of the five classes of BrdU incorporation into TNbs are shown. In all panels anterior is to the left, posterior is to the right. Scale bar in panel D indicates 25 um. D) None (class 1). E) Few (class 2). F) Segmentally repeated lines with few extra neuroblasts (class 3). G) Segmentally repeated lines with several scattered neuroblasts (class 4). H) Heavily populated segmental pattern (class 5).

