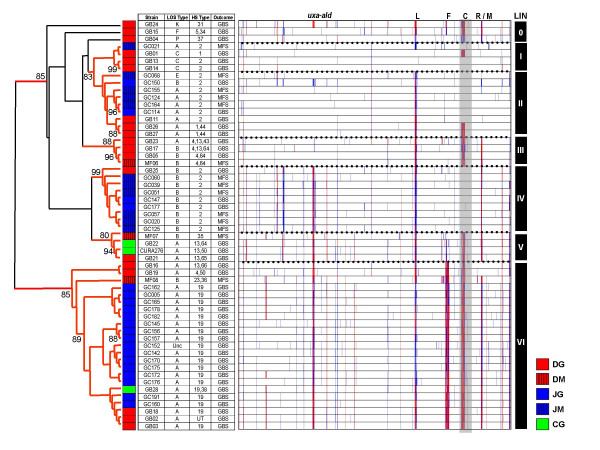
Figure 1.
CGH profiles for the 56 neuropathogenic strains in the combined dataset. The 56 neuropathogenic strains analyzed for this study show substantially different genetic backgrounds, although most appear to belong to one of six major lineages (LIN). Three strains show unique gene conservation profiles and fail to cluster robustly with any major lineage. Branches with greater than 75% bootstrap support are shown in red. Although data is displayed including capsular genes (gray box), these genes were removed during cluster analysis to avoid biasing results. Highly divergent/Absent genes shown in red; Moderately Divergent genes are shown in blue. Legend: Hypervariable loci (L – LOS locus; F – flagellar modification locus; C – capsular locus; R/M – restriction-modification locus); Strain sets (DG: Dutch GBS; DM: Dutch MFS; JG: Japanese GBS; JM: Japanese MFS; CG: Curaçao GBS).

