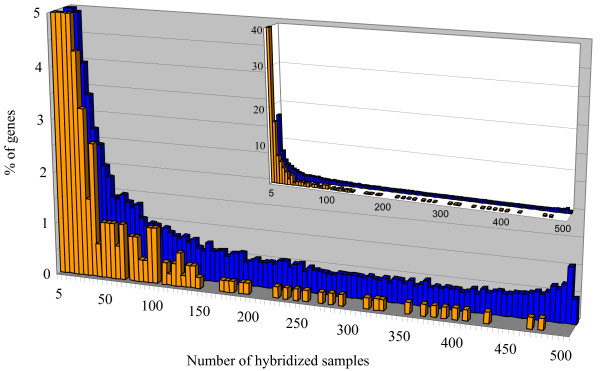
Figure 5.
Expression range of the novel genes. The genes are distributed according to the number of samples (out of 522) in which they have been found expressed. Values for % of genes are truncated at 5%. Data for all the Arabidopsis genes are represented in blue and those for the 465 novel genes are represented in orange. In the inserted chart % of gene values are not truncated.

