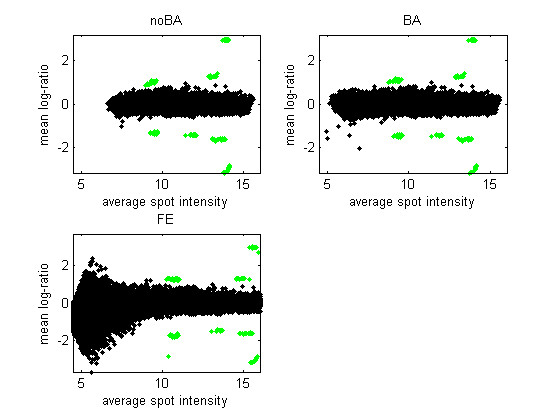
Figure 2.

Average log-ratios calculated from five replicate arrays. The average log-ratio is plotted against the average spot intensity for the three versions of the data from Site 1 and RNA A (five arrays). Green points are the ERCs with non-zero true log-ratio.
