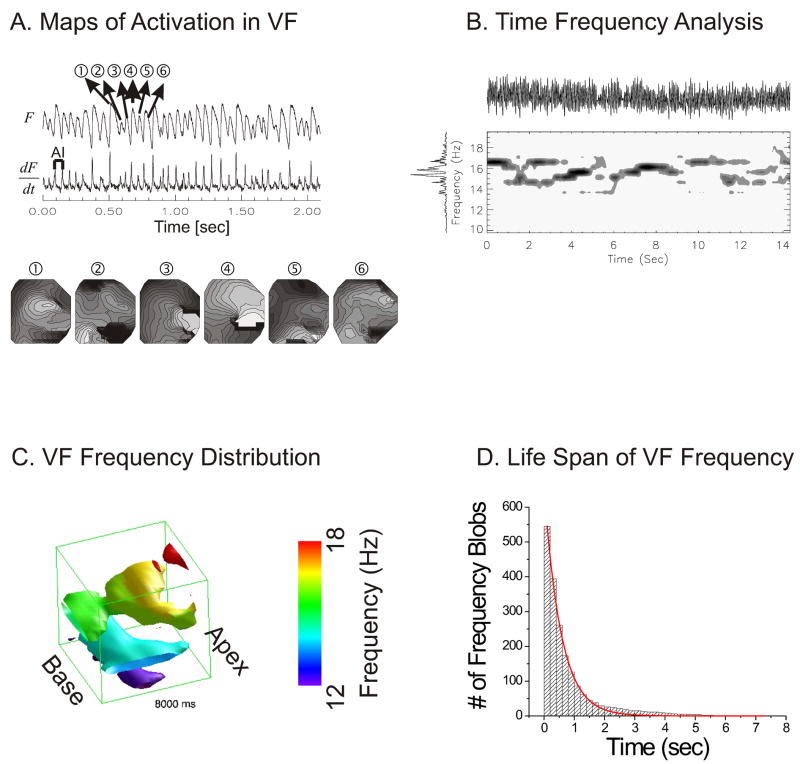
Figure 1. Time frequency analysis of VF traces.
(A) A typical example of fluorescence trace recorded from one pixel (top trace) and their first derivatives (bottom trace). Activation maps of 6 consecutive VF beats (lower panel) show a marked lack of reproducibility and periodicity of the depolarization sequence. Isochrones are 1 ms apart; bright to dark represents the sequence of depolarization. (B) Time frequency distribution (TFD) from one pixel. TFD was calculated by cone shaped kernel (1.5 s window) over normalized optical traces. Top: optical trace, Left: overall FFT spectra. Contour map: spectrogram with isolines drawn every 12.5 % of maximum. Spectrograms plot frequency (ordinate) vs. time (abscissa) and is shown for 14 s of VF; the darker the color, the higher the energy density at that frequency. (C) Spatial distribution of VF frequencies. Time-frequency analysis was extended to all photodiodes and the spatial distribution of VF frequencies at time t was reconstructed as iso-surface plots. (D) Life span of VF frequencies. The majority of VF frequencies lasted less than 1 s (half life = 0.39 ± 0.13 s).

