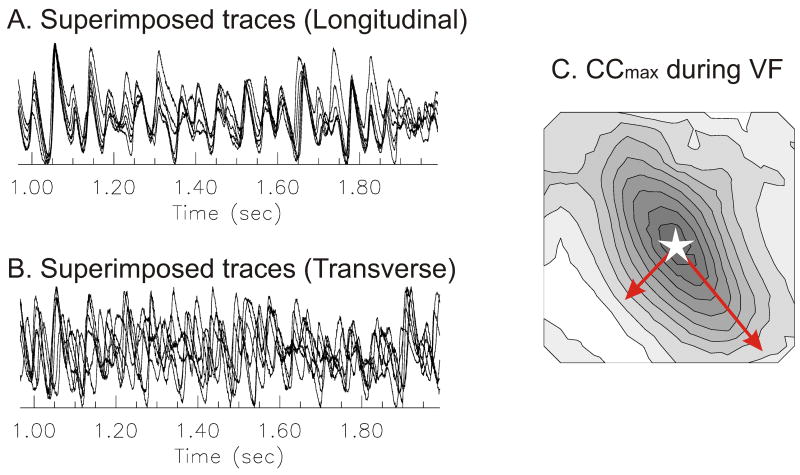
Figure 2. Tissue anisotropy and maximum cross correlation (CCmax) map in VF.
(A&B) Superimposed traces along longitudinal and transverse direction (see arrows in panel C). Note that activations across the longitudinal direction are well synchronized compared to the transverse direction. (C) Map of CCmax. The map of CCmax during VF was generated as described in Methods. The pixel at the center of the array was chosen as the reference site (open star). The map revealed an anisotropic distribution of CCmax, with elliptical patterns of CCmax similar to the elliptical pattern of propagation obtained by pacing the heart at the center of the field-of-view (panel D). Isochronal lines are drawn every 10% of maximum CCmax. (D) Activation map during stimulation. The heart was stimulated near the center of field-of-view (open star) and the activation map was displayed as a contour map. Activation was faster along the longitudinal axis of fiber on the left epicardium, resulting in an elliptical spread of propagation. Isochronal lines are drawn every 1 ms.

