
Fig. 4.
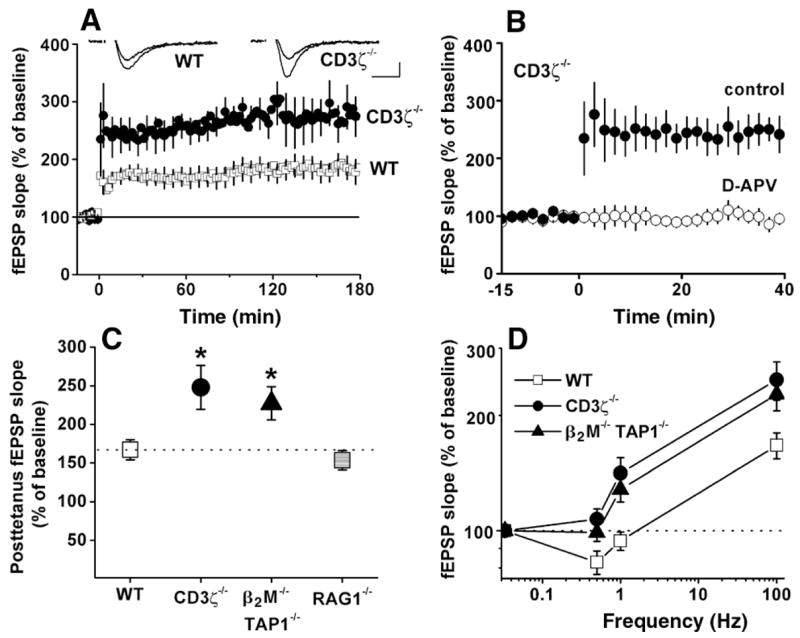
Enhanced hippocampal LTP in mice deficient either for cell surface class I MHC expression or for CD3ζ. (A) Field EPSP (fEPSP) slopes in wild-type versus CD3ζ −/−-deficient mice. Tetanus was applied at time 0. (Insets) Superimposed sample fEPSPs recorded 10 min before or 180 min after tetanic stimulation from individual wild-type (left) and CD3ζ−/− (right) slices. Scale bar, 10 msec/0.25 mV. (B) NMDA receptor dependence of LTP in CD3ζ-deficient mice. Tetanus was applied at time 0 either in the absence [filled circles; from (A)] or presence (hollow circles) of 50 μM D-APV. All points in (A) and (B) are averages of four consecutive fEPSPs (means ± SEM, normalized to 15-min baseline) recorded from CA1. (C) Graphs summarizing degree of potentiation in wild-type, β2M−/−TAP1−/−, CD3ζ−/−, or RAG1−/− mice after 100-Hz tetanus. Data are shown for mice with histologically normal brains (48). Asterisks indicate significant differences from wild type (one-way ANOVA, P < 0.05). (D) Relation (logarithmic plot) between synaptic enhancement and stimulation frequency. Points at 0.033 Hz (test pulse frequency) indicate baseline values (horizontal dashed line). Points at 100 Hz are taken from (C). Values in (C) and (D) are mean fEPSP slopes for each genotype over the 1-hour period following tetanus. See text and (34) for methods.