
Figure 4.
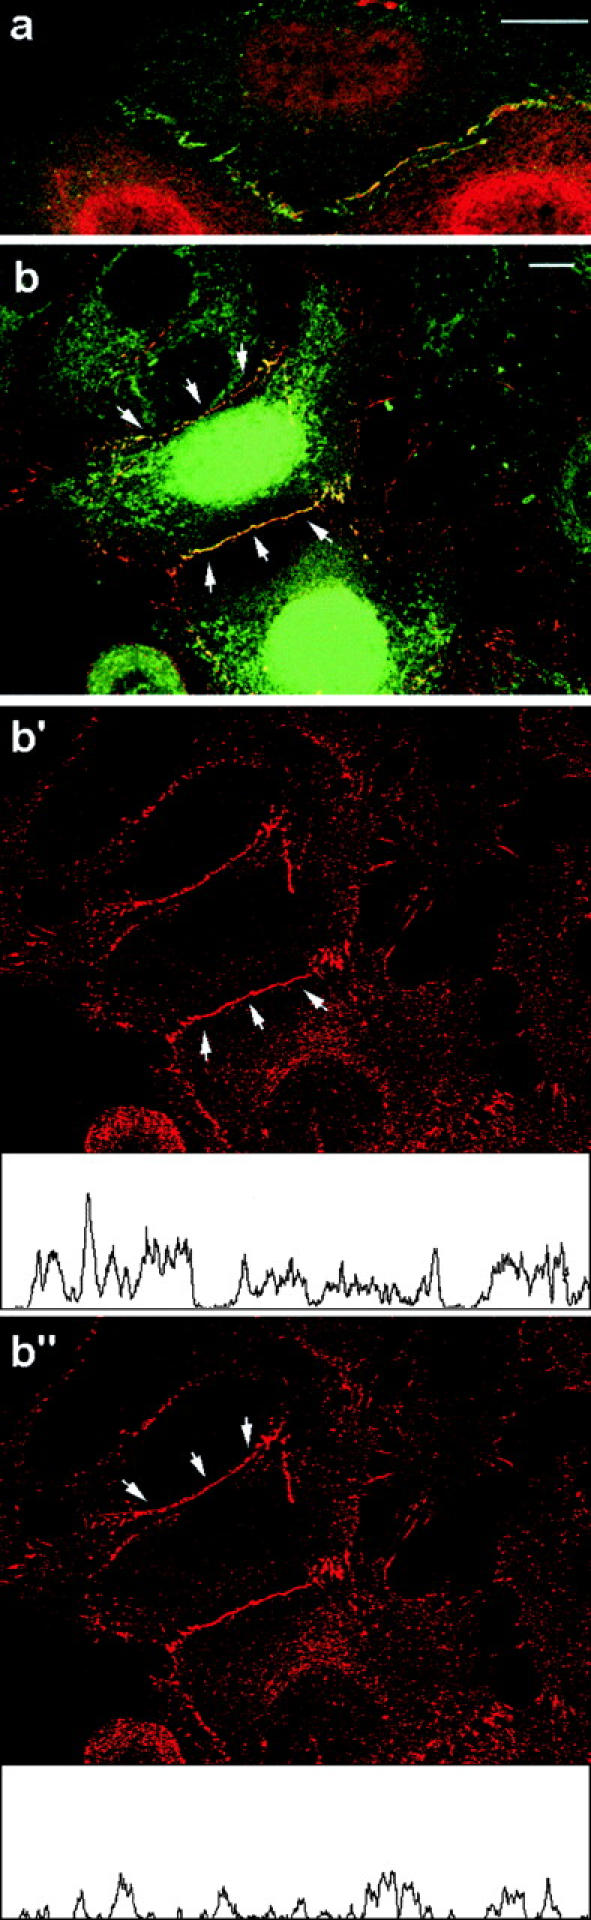
Laser scanning microscopy analysis of HaCaT cells expressing the plakophilin 1 head domain. (a) Cells were stained with the plakophilin 1 head domain antibody (red fluorescence) and the anti–Pan-cadherin antibody (green fluorescence). Overlay of both fluorescence signals showed only little overlap along the plasma membrane, demonstrating that the major portion of plakophilin 1 does not localize to adherens junctions. (b) Cells were stained with the plakophilin 1 head domain antibody (green fluorescence) and an antidesmoplakin antibody (red fluorescence). A high degree of colocalization is visible along cell borders of transfected cells (arrows), demonstrating that plakophilin 1 is recruited primarily to desmosomes. To test whether the size or the number of desmosomes is affected by this recruitment, we recorded fluorescence intensities in the desmoplakin channel by scanning along two defined plasma membrane stretches (arrows, b′ and b′′). The scan results are displayed as intensity profiles below the corresponding image. In the profile recorded along a cell border between two transfected cells (b′), the peak size and number are increased when compared with the profile recorded along a cell border between a transfected and a nontransfected cell (b′′). Note that photobleaching during the scan accounts for the slight differences in the two fluorescent pictures. Bars, 10 μm.