
Figure 4.
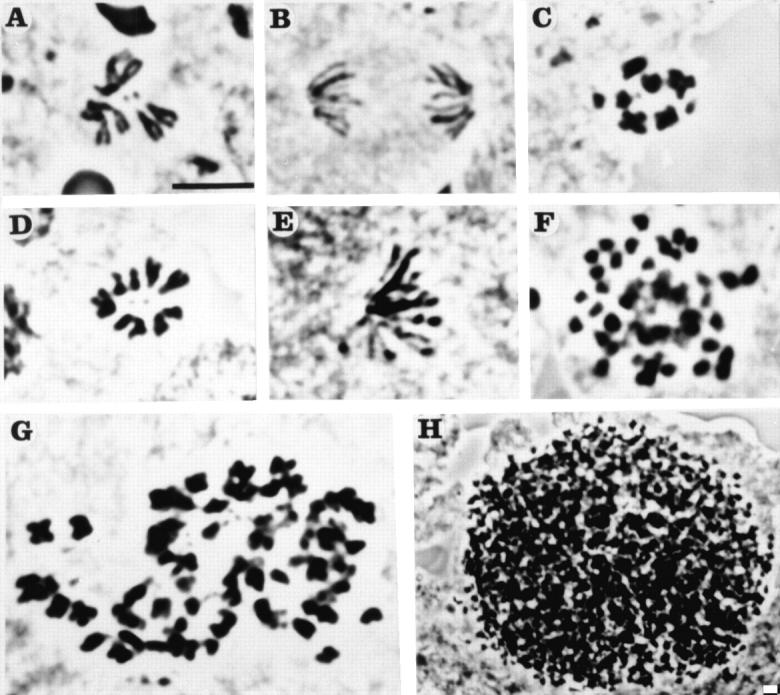
Cytological phenotypes in squashed preparations of larval CNS cells from third instar larvae homozygous for orbit or from third instar larvae trans-heterozygous for orbit 3 and Df(3L)orbit2. A diploid wild-type metaphase (A) or anaphase (B) figure. C, A diploid metaphase figure with hypercondensed chromosomes from orbit larva. D, A circular mitotic figure from orbit homozygotes. Note that for a cell to be scored as having a circular figure, all arms of the major chromosomes were oriented to the periphery and the small dot-like fourth chromosomes were in the center of the circle. E, A monopolar anaphase-like figure in which all chromatids appear to be pulled toward a single pole. F, A polyploid mitotic figure from the genotype orbit 3 /Df(3L)orbit2, in which the chromosomes are highly condensed. G, A polyploid mitotic figure containing hypercondensed chromosomes from an orbit larva. H, A view at lower magnification of an extremely hyperploid mitotic figure from an orbit 3 /Df(3L)orbit2 larva. More than 100 dot-like chromosomes were contained in this single mitotic cell. Bar, 10 μm.