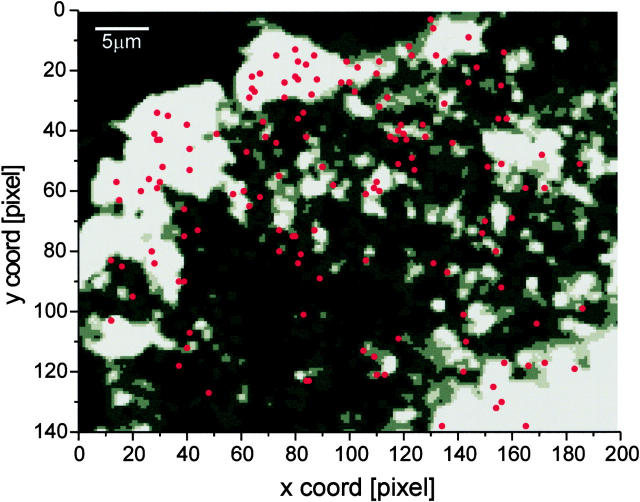
Figure 5.
Map of fusion sites of a single cell. The exocytotic events (n = 147) from a single cell were superimposed as red dots onto a thresholded gray scale image of VSVG-GFP in the plasma membrane (see Materials and Methods). One edge of the cell is in the upper left. Under epi-illumination, the Golgi complex appeared in the lower right corner. Pixel size, 268 nm.

