
Figure 2.
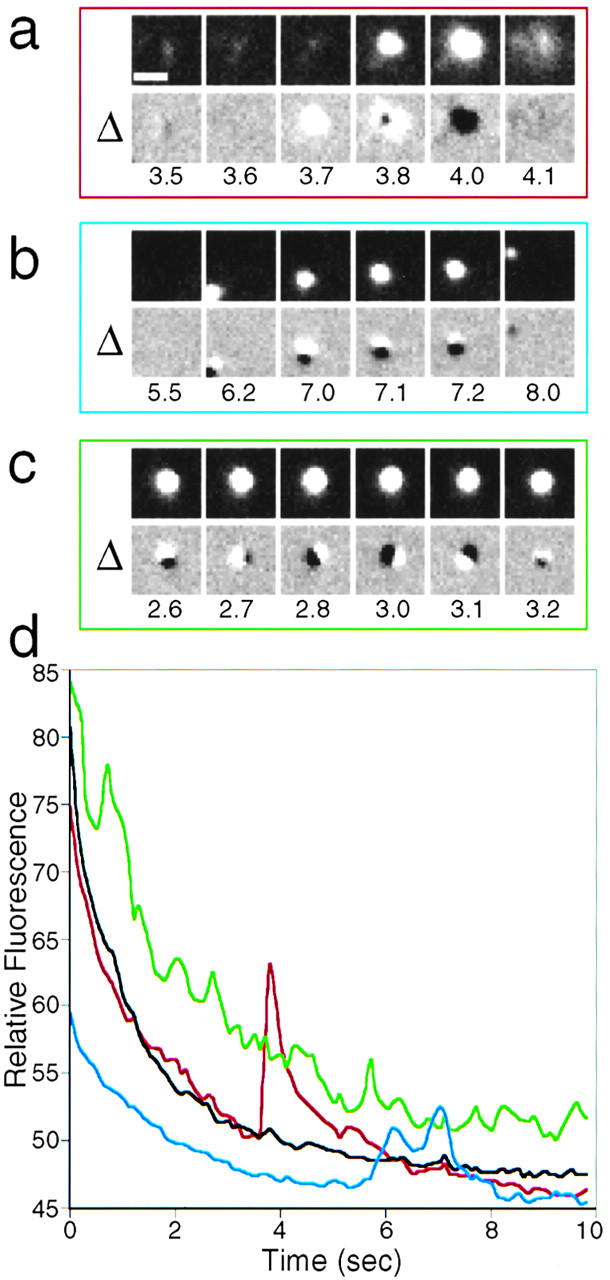
Fusion at the plasma membrane gives a unique signature. See also accompanying QuickTime movie available at http://www.jcb.org/cgi/content/full/149/1/33/DC1. In any given field (a–c, top) TCs were observed to either fuse (a), move across (b), or hover (tethered, but with motion in the z-axis) above the plasma membrane without undergoing fusion (c). A differential analysis (Δ, see Materials and Methods) allows one to distinguish these possibilities. A true fusion event results in sequential white and black clouds which expand as donutlike rings (a). TCs moving across the field result in black and white dots that keep their respective orientation (b). A TC hovering above the plasma membrane yields an asymmetric pattern in which the relative orientation of the dots changes over time (c). (d) Relative fluorescence intensity measured by TIR in fields (a–c) over time. Note that only a true fusion event (red trace) leads to a sharp increase in the fluorescence signal, generating an asymmetric peak with a long trailing edge as the protein diffuses into the membrane. The black curve shows the fluorescence intensity in an adjacent area without TCs; the initial decrease in fluorescence intensity is due to photobleaching at the plasma membrane which also facilitates detection of newly fusing TCs. Bar: 1 μm. Time is indicated in seconds.