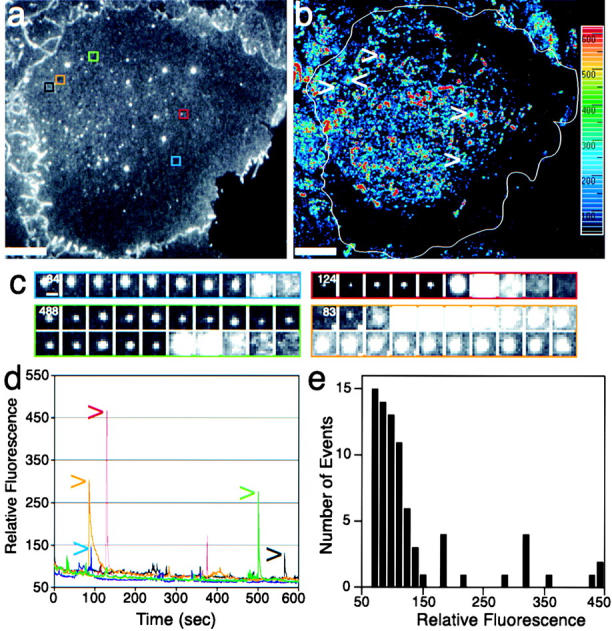
Figure 4.

TCs fusing at the plasma membrane are heterogeneous in size and kinetics. See also accompanying Quick-Time movies available at http://www.jcb.org/cgi/content/full/149/1/33/DC1. (a) Cell surface visualized by TIR. (b) A time projection of difference images (see Materials and Methods) highlights TC fusion and movement. While there is substantial activity in the central region (red to light blue), only a few fusion events occur in the cell periphery (purple to black). Strong fusion events are seen as a red dot surrounded by a blue halo. Sequential frames (c) and the fluorescence intensity plot (d) of the areas marked in a and b show fusion events of different magnitude. Frames of the black square are shown in Fig. 3. Time of the first frame in the sequence is indicated in seconds. (e) Histogram of the relative intensity for all fusion events observed in this cell. Bars: (a and b) 10 μm; (c) 1 μm.
