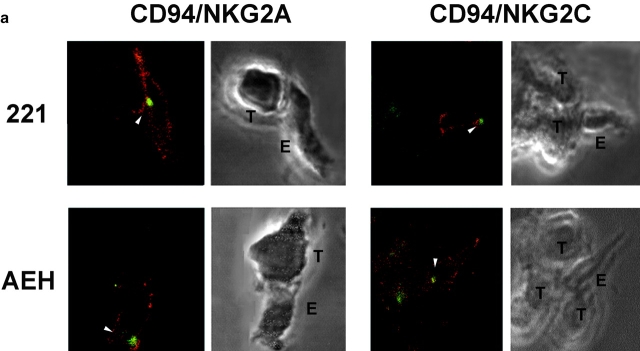
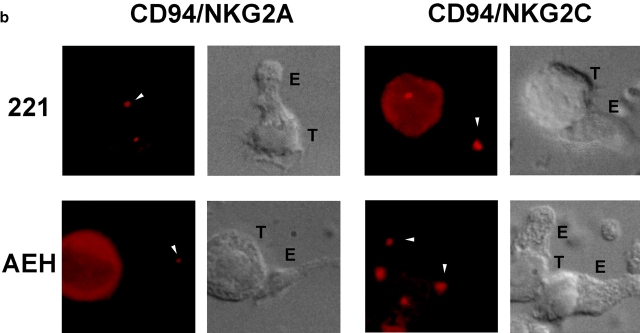
Figure 4.
PYK-2 and the MTOC are translocated to the area of cell–cell contact of NK cells with target cells during specific recognition and cytotoxicity. (a) Confocal sections showing PYK-2 localization on NK cell clones (E) which are inhibited (CD94/NKG2A), or activated (CD94/NKG2C) by HLA-E, and that were interacting with HLA-E− (.221) or HLA-E+ (AEH) target cells (T). Cell–cell conjugates were stained for PYK-2 (green) and CD94 (red) and analyzed using confocal microscopy. Confocal sections under brightfield illumination are shown for each conjugate. Arrowheads show the localization of PYK-2 on effector cells. (b) MTOC localization on NK cell clones that are inhibited (CD94/NKG2A), or activated (CD94/NKG2C) by HLA-E, and that were interacting with HLA-E− (.221) or HLA-E+ (AEH) target cells. Cell conjugates stained for γ-tubulin were photographed under epifluorescence (red) and brightfield conditions using a Nomarski 60× objective. T and E indicate target and effector cells, respectively, while arrowheads point to the MTOC on effector cells.


