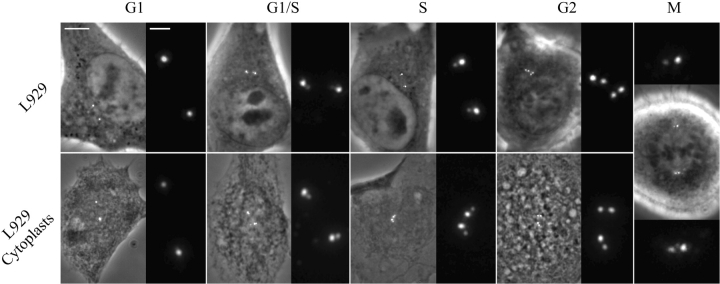
Figure 1.
Cell cycle changes in the distribution of centrin/GFP. Top row, L929 cells; bottom row, cytoplasts obtained from the same clone. For each period, the left picture is a superimposition of the GFP fluorescence and phase-contrast images, and the right picture is a 4× magnification of the GFP channel. Note that the distance between the two GFP dots in each diplosome increases from G1/S to S and G2. Bar, 5 μm for phase contrast images and 1 μm for higher magnification.

