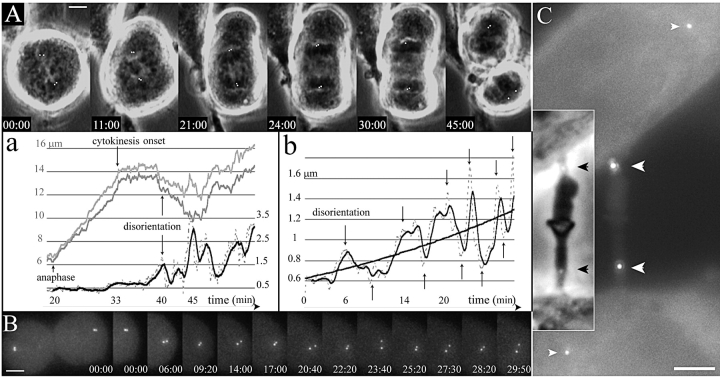
Figure 2.
Centriole disorientation occurs early after the onset of cytokinesis. (A) Selected frames from a time-lapse recording of mitosis in HeLa cell progressing from metaphase to telophase. The top row shows selected phase contrast pictures with the GFP signal in white (centrioles signals were manually enhanced), whereas the behavior of the bottom centrosome during the complete recording is described on the corresponding graphics (a). The two upper curves (grey) are the distance of each centriole of the bottom centrosome to a fixed point at the center of the metaphase plate in the first frame (scale on the left). It mainly shows the increasing distance during anaphase and the differential movements of each centriole after cytokinesis onset. The lower curves are the distance between the two centrioles of the bottom centrosome (dotted line), and a mobile mean fit (black line; scale in μm on the right). It shows an almost constant distance (the little increase at 33 min is due to a rotation of the diplosome) until time 40 min after metaphase shown on the top left (20 min after anaphase) when it reaches a distance incompatible with a close association of the two centrioles. (B) One sister cell spreading after furrowing onset. Z-series were acquired every 10 s. The bottom row shows the GFP signal of the right sister cell at times corresponding to the arrows on the graph (b), showing the alternative splitting and joining of the centrioles. The curves in b are the distance between the two centrioles of the right centrosome (dotted line), and a mobile mean fit (black line). A logarithmic fit shows the globally increasing distance between both centrioles. (C) Two daughter cells still linked by a midbody in early G1. Two centrioles are located in the midbody (large white arrowheads) while the other two are far inside the cells (small white arrowheads). (Inset) The two black arrowheads show the location of the centrioles on the phase contrast picture of the midbody. Supplemental video is available at http://www.jcb.org/cgi/content/full/149/2/317/DC1. Bars, 5 μm.

