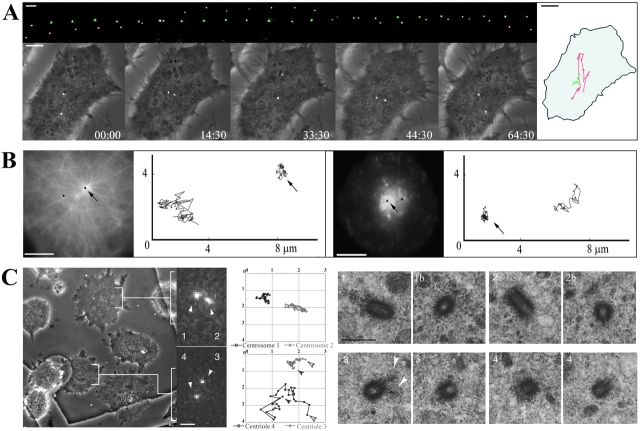
Figure 4.
(A) Centriole behavior in G1 cytoplasts. The top row is of GFP images (at 6-min intervals) in which the nonmotile centriole was colored green while the motile one red. In the bottom row the GFP images are superimposed on phase-contrast images of the same cell (time = min/s). The diagram on the right represents the centrioles trajectories in relation to the cell boundaries. (B) The immotile centriole acts as the centrosome. G1 cytoplasts injected with rhodamine-tubulin (left panel) or having incorporated the B fragment of Shiga toxin coupled with Cyanin 3 (right panel) were video-recorded in two channels (GFP and rhodamine) during 10 min with a 4-s time-lapse. The pictures shown correspond to the first frame. The trajectories of the centrioles (in black on the pictures) are shown on the right. Arrows point to the immotile centriole. (C) The immotile centriole is the mother centriole. Movements of centrioles were recorded during 20 min, with 30-s time-lapse, in cytoplasts seeded on a gridded coverslip which were then flat embedded and processed for EM (see Materials and Methods). (Left) Phase contrast and GFP signals of the last frame. (Middle) Trajectories. The GFP signal appears pixelized because pictures were acquired at low resolution (63× objective and binning mode) in order to have at least 10 cells in a field. In these conditions, it was not possible to resolve the buds in duplicating centrioles at the optical level. (Right) High-voltage EM after semi-thick serial sectioning. The top row corresponds to the upper cytoplast and the bottom row to the lower cytoplast. The upper cytoplast contains two immotile GFP dots (1 and 2) which were revealed as two diplosomes by EM (1 and 1b, 2 and 2b). The lower cytoplast contains a motile (4) and an immotile (3) GFP dot, which corresponded to two centrioles. Two consecutive serial sections of each centriole are presented. The immotile centriole was identified as the mother centriole by the presence of appendages (white arrowheads). Supplemental video is available at http://www.jcb.org/cgi/content/full/149/2/317/DC1. Bars: (A and B) 5 μm; (C, GFP signal image) 2 μm; (C, phase contrast image) 8 μm.

