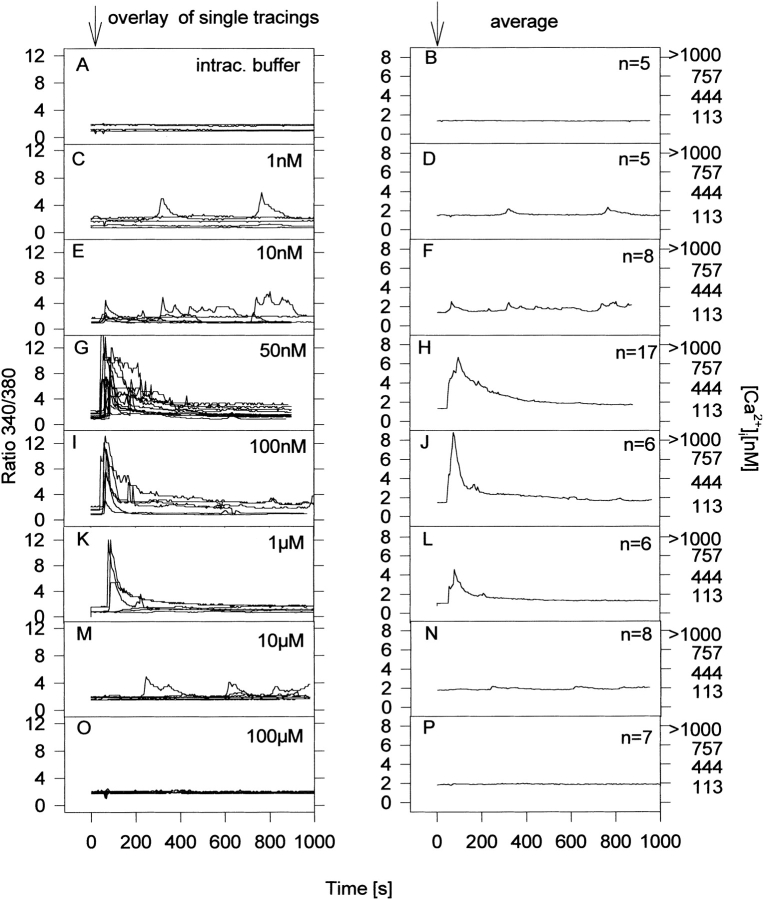
Figure 1.
Concentration-response curves of Ca2+ signals in single intact T-lymphocytes microinjected with NAADP+. Jurkat T-lymphocytes were loaded with Fura2/AM and Ca2+ was measured as detailed in Materials and Methods. Cells were injected as described in Materials and Methods in the presence of 1 mM extracellular Ca2+. Data are presented as overlays of single tracings of individual cells (left). The right shows the corresponding averages from these measurements (number of cells displayed, n = 5–17). As a control, vehicle buffer without NAADP+ was injected (A and B). The time points of microinjection are indicated by arrows.

