
Figure 3.
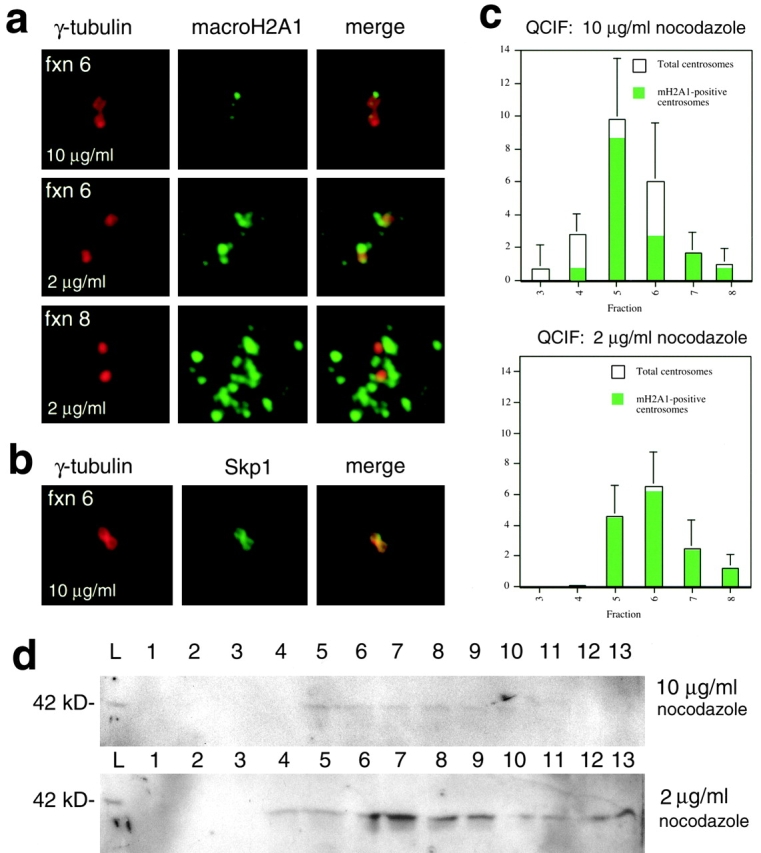
Quantitative analysis of centrosomes obtained by cell fractionation of undifferentiated ES cells. a, Typical examples of isolated centrosomes analyzed by γ-tubulin/macroH2A1 double immunofluorescence from fraction 6 (10 μg/ml or 2 μg/ml nocodazole pretreatment) and fraction 8 (2 μg/ml nocodazole pretreatment). b, Typical example of centrosome isolated from fraction 6 (10 μg/ml nocodazole pretreatment) immunostained for γ-tubulin and Skp1 (both established components of centrosomes). c, QCIF (Bornens et al. 1987; Mitchison and Kirschner 1986) of undifferentiated ES cells pretreated with nocodazole for 1 h at 10 μg/ml and 2 μg/ml. Identical quantities of input cells were used in both fractionations. Total centrosomes from 15 μl samples from each sucrose fraction were quantitatively sedimented onto round coverslips and the mean number of centrosomes (detected by γ-tubulin immunofluorescence) per 100× oil immersion field was determined. Green areas within bars represent the relative proportions of centrosomes that contained macroH2A1 anchored to centrosomes. Data from fractions 3–8 (fractions with significant numbers of centrosomes) are shown. Lower fraction numbers correspond to higher sucrose concentrations. d, Immunoblot of macroH2A1 present in sucrose fractions. Fractions are numbered from 1 (bottom of gradient) to 13. The lanes marked L contain samples of equal volume from the initial lysates later subjected to sucrose ultracentrifugation. Equal numbers of input cells were used for both fractionations (10 μg/ml and 2 μg/ml nocodazole pretreatments).