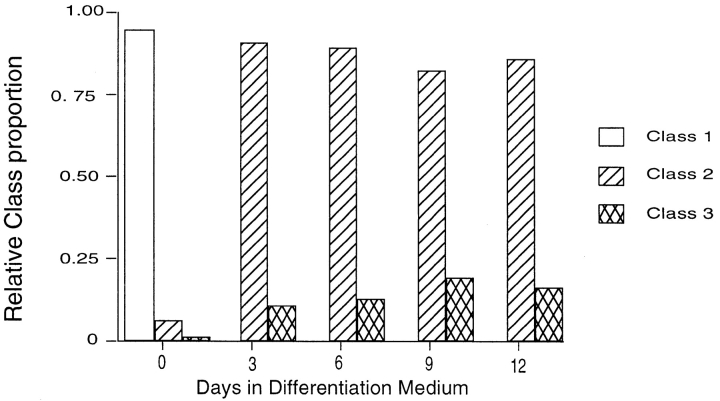
Figure 5.
Quantitation of changes in localization of macroH2A1 with respect to the centrosome and the Xi during retinoic acid induced differentiation and X inactivation. Quantitation of relative proportions of class 1, 2, and 3 cells in differentiating female ES cell cultures. At least 200 cells were counted from each sample. Class 1, Biallelic expression of Xist RNA with centrosomic macroH2A1. Class 2, monoallelic cloud-like Xist RNA expression without macroH2A1 colocalization. Class 3, monoallelic cloud-like Xist RNA expression with discrete macroH2A1 colocalization.

