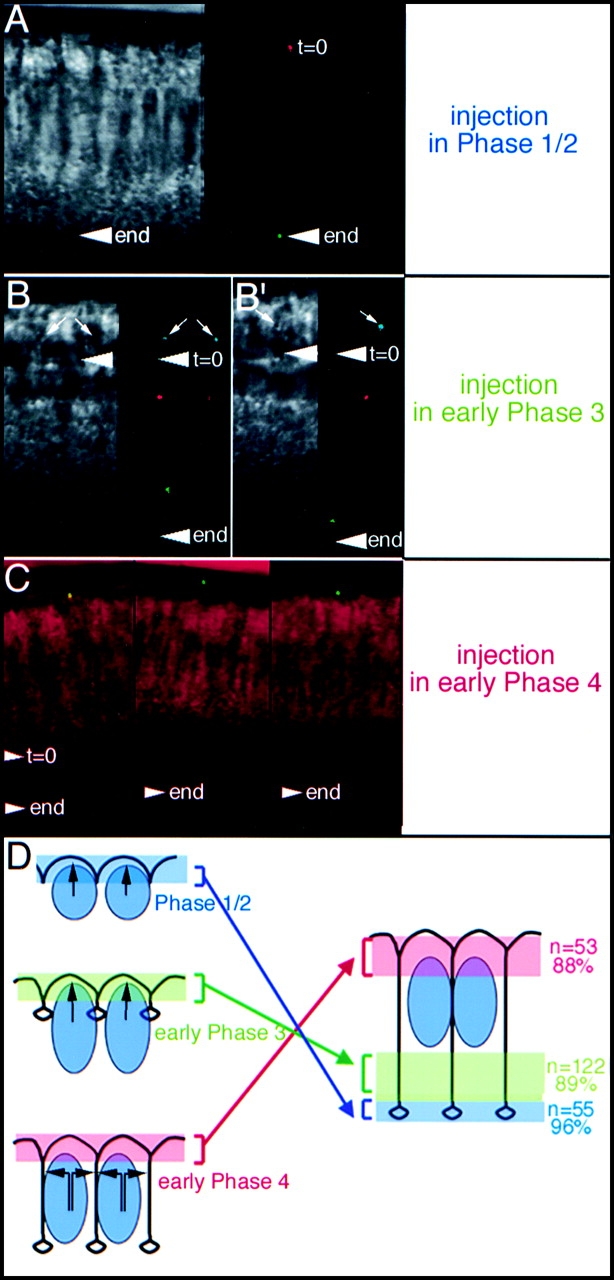
Figure 4.

Injection of beads in phase 1/2. (A) Right panel shows a bead at time 0 (red) and the end of phase 4 (green). Left panel shows the DIC image corresponding to the final time point. The arrowhead shows the FC position. (B and B′) Injection in early phase 3. The arrowhead in all images shows the position of the FC at time 0 and the end of phase 4 (end). The DIC image (left) shows the initial time points and the beads (right) are shown in a color-coded fashion: blue at time 0, red later, and green at the end. Note, the beads have accompanied the movement of the FC. The apparent brightness of the beads varies as their position with respect to the confocal optical slices changes during cellularization. (C) Injection in early phase 4. The beads (green) are shown at the end of cellularization together with the DIC image (red). The arrowheads show the relative movement of the FC during the time lapse. (D) Summarizes the observations. Beads are displaced within membrane regions in accordance with the times of injection. Black arrows indicate the sites of membrane insertion.
