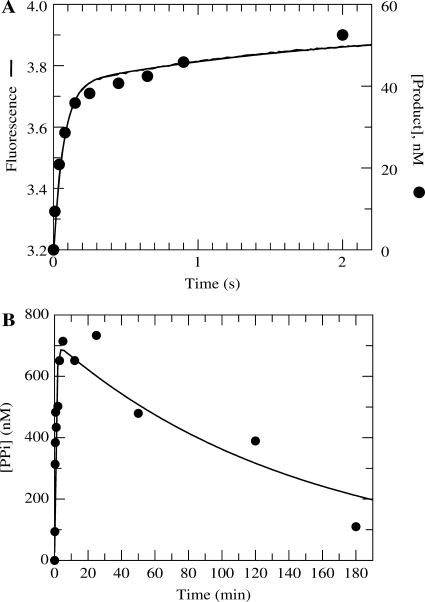
Figure 3.
Comparison of PPi release following incorporation using TTP or AZT-TP. (A) Exonuclease-deficient holoenzyme (100 nM) was preincubated for 5 min with 2.5 mM Mg2+, 90 nM 25/45-mer DNA, 1.5 μM E. coli PBP mutant labeled at Cys197 with the fluorescent compound MDCC, 100 μM 7-methylguanosine, 0.02 U/ml purine nucleotide phosphorylase and 0.005 U/μl yeast inorganic PPase and then rapidly mixed in the stopped-flow apparatus at 20 ° C with 2.5 mM Mg2+, 50 μM TTP, 100 μM 7-methylguanosine, and 0.02 U/ml purine nucleotide phosphorylase. PPi dissociation was monitored by observing the change in fluorescence that results from Pi binding to the MDCC-labeled PBP (smooth line). Shown also are quench-flow data from a parallel experiment monitoring the DNAn+1 formation using a radiolabeled primer strand (filled circle). (B) Exonuclease-deficient holoenzyme (1 μM) was preincubated with 900 nM 25/45-mer DNA and mixed with 300 μM γ-32P-labeled AZT-TP and 2.5 mM Mg2+ to start the reaction. The amount of PPi (or PPi in equilibrium with AZT-TP) that remained associated with Pol γ as a function of time is shown on the plot. The data were fitted to a double exponential equation to obtain an observed fast phase rate and amplitude of 1.2 ± 0.3 min−1 and 700 ± 70 nM, respectively. The observed rate and amplitude of the slow phase were 0.007 ± 0.002 min−1 and 700 ± 50 nM, respectively.

