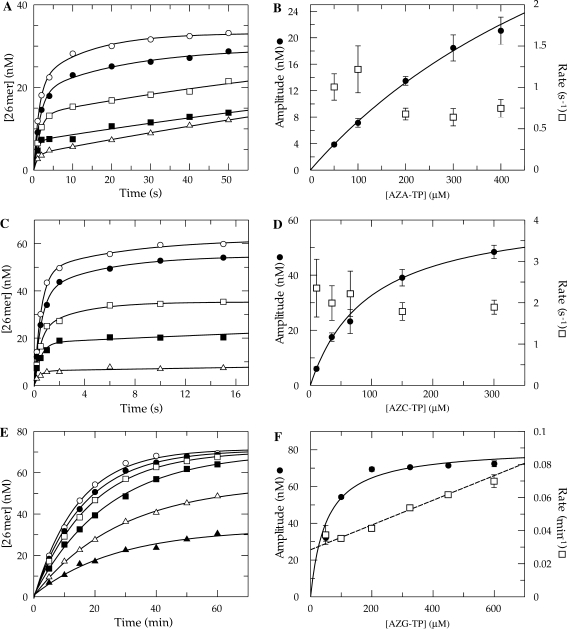
Figure 6.
Kinetics of incorporation using azide-substituted analogs. (A) Exonuclease-deficient holoenzyme (100 nM) was preincubated with 90 nM 25/45-mer DNA (radiolabeled primer) and then rapidly mixed with Mg2+ and various concentrations of AZA-TP [50 (open triangle), 100 (filled square), 200 (open square), 300 (filled circle) and 400 μM (open triangle)]. Each data set was fitted using a double exponential equation. (B) The amplitude for fast phase of each reaction was plotted as a function of AZA-TP concentration (filled circle). A fit of the data to Equation (2). yields an apparent Kd of 800 ± 120 μM and a maximum amplitude of 65 ± 8 nM. The observed rate of the fast phase of each reaction was also plotted as a function AZA-TP concentration (open square). (C) Single turnover reaction performed using AZC-TP [10 (open triangle), 35 (filled square), 65 (open square), 150 (filled circle) and 300 μM (open circle)]. (D) The amplitude was plotted as a function of AZC-TP concentration (filled circle). A fit of the data predicts an apparent Kd of 96 ± 6 μM and a maximum amplitude of 64 ± 2 nM. The observed rate of the fast phase of each reaction was also plotted (open square). (E) Single turnover reaction using AZG-TP [50 (filled triangle), 100 (open triangle), 200 (filled square), 325 (open square), 450 (filled circle) and 600 μM (open square)]. Each data set was fitted using a single exponential equation. (F) The amplitude was plotted as a function of AZG-TP concentration (filled circle) to define an apparent Kd of 50 ± 10 μM and a maximum amplitude of 81 ± 3 nM. The observed rate of each reaction was also plotted and fitted by linear regression to obtain a slope of (7.5 ± 0.5) × 10−5 μM−1 min−1and a Y-intercept of 0.028 ± 0.002 min−1 (open square).

