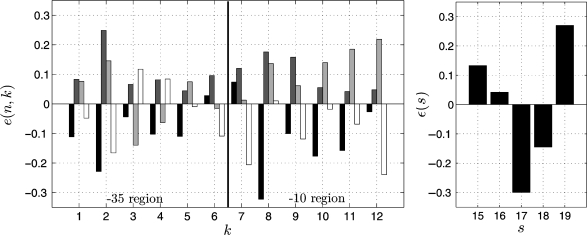
Figure 1.
Partial binding energy contributions as extracted from (9) and modified. Left: partial binding energies e(n, k) of nucleotides for each position k ∈ [1;12] of the promoter ( k ∈ [1;6] reference the positions of the -35 region, k ∈ [7;12] those of the −10 region). Color scheme: Black = A, dark gray = C, light gray = G, white = T. Right: Contribution ε(s) of the spacing s ∈ [15;19] between the promoter regions to the binding energy.

