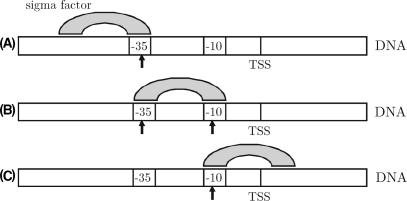
Figure 4.
The two side-minima at positions −58 and −12 observed in Figure 3 are likely to occur due to correlation between the two promoter regions. (A): At position -58, the -10 part of the weight matrix W is overlapping the −35 promoter region. (B): The minimum at −35 reflects the actual recognition of both promoter regions. (C): At position −12, the −35 part of the weight matrix W is overlapping the −10 promoter region.

