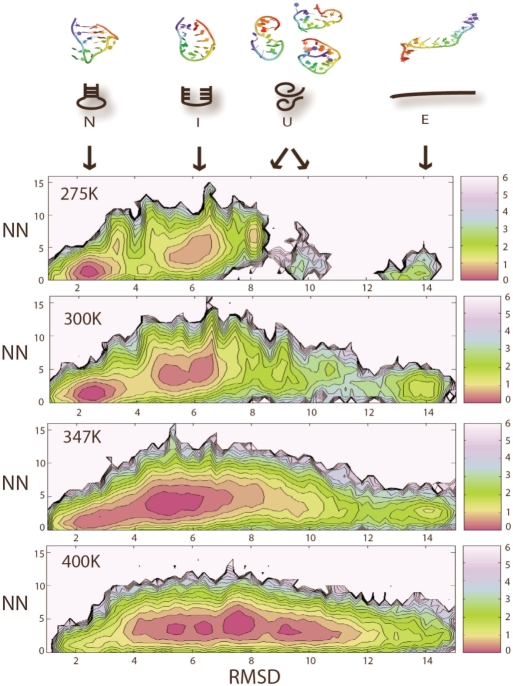
Figure 4.
Temperature dependence of the hairpin energy landscape. The PMF of the hairpin is plotted as a function of hairpin RMSD (compared of crystal conformer) versus the number of non-native hydrogen bonds (NN) at 275, 300, 347 and 400 K. Local minima are considered to be significant when they contains more than 2% of the population and are separated by a barrier of at least 1.5 kcal/mol. All RMSD values are in Angstroms units (Å). PMF is plotted in units of kcal/mol, where 1 kcal roughly equals to 0.6 KT at 300 K.

