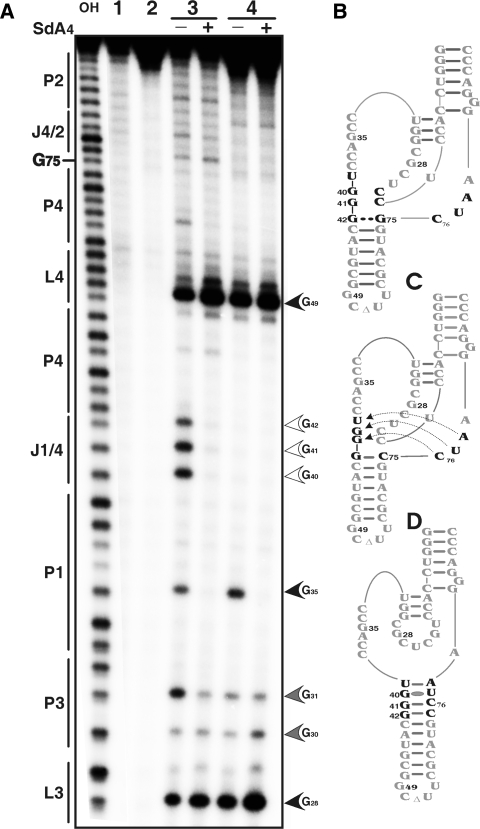
Figure 7.
RNase T1 mapping of the wild type and homopurine bp mutant ribozymes. (A) Autoradiogram of a 10% PAGE gel of T1 probing performed with 5′-end-labelled wild-type and mutated trans-acting ribozymes. Alkaline hydrolysis of the wild-type ribozyme was performed in order to determine the location of each position (lane OH). Lanes 1 and 2 are negative controls (no reaction and no substrate) performed with the wild-type and mutant RzG75C ribozymes, respectively. RNase T1 hydrolysis was performed on both the wild-type ribozyme (lane 3) and the RzG75C (lane 4) either in the absence or the presence of the SdA4 analogue as indicated by the symbols (−) and (+), respectively. The sites of RNase T1 hydrolyses are identified, and intensities of the hydrolyses correlate with the intensities of the arrow heads. The positions of the guanosines are indicated on the left. (B) to (D) are schematic representation of the nucleotide sequences and secondary structures of the ribozymes. (B) is the wild-type ribozyme. (C) and (D) are two secondary structures for the RzG75C mutant that differs for the J1/4 and J4/2 junctions.

