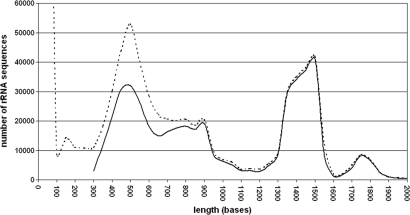
Figure 1.
Sequence length distribution of rRNA genes in the SILVA 91 SSU database. The dotted line represents the sequence distribution directly after importing, the solid line after quality checks and alignment. The huge amount of sequences around 100 bases reflect the first impact of tag sequencing approaches.

