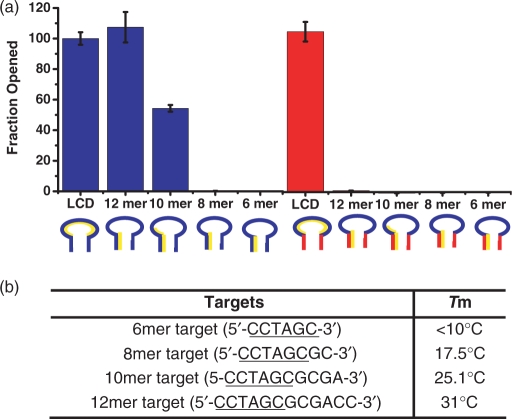
Figure 5.
Comparisons of selectivity of LS MB 1 and DS MB 1. (a) A final concentration of 100 nM MB was incubated with 1 μM of each target for 1 h and the fluorescence signal was measured. The experiment was repeated five times and the average value and SD were calculated. (b) The calculated melting temperature of each target with its complementary sequence.

