Figure 5.
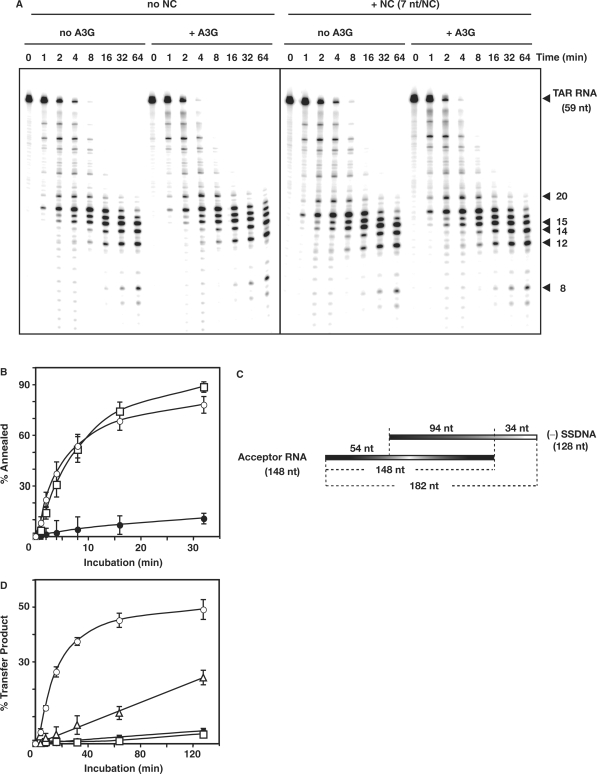
Effect of A3G on minus-strand transfer reactions. (A) Effect of A3G on the time course of RNase H cleavage in the absence or presence of NC. 32P-labeled TAR RNA (0.1 pmol) and TAR DNA (0.2 pmol) were heat annealed and the hybrid was incubated at 37°C in reaction buffer (see above) with 0.4 pmol HIV-1 RT with or without NC (7 nt/NC, 0.1 µM), with or without A3G (80 nM). Samples were loaded on a 15% denaturing gel. Positions of the major cleavage products are indicated on the right. (B) Time course of annealing of 32P-labeled DNA 128 to RNA 148 incubated in the absence or presence of A3G (80 nM) with or without NC (3.5 nt/NC, 0.4 µM). Symbols: no NC/+A3G (filled circles); +NC/no A3G (open squares); and +NC/+A3G (open circles). (C) Schematic diagram illustrating the minus-strand transfer assay system. The R homology is 94 nt; U5 and U3 are 34 and 54 nt, respectively. (D) Graph of percent transfer product plotted versus incubation time. To quantify the percentage of strand transfer, the amount of transfer product was divided by the total amount of DNA, multiplied by 100. Symbols: no NC/no A3G (filled circles); no NC/+A3G (open squares); +NC/no A3G (open circles); and +NC/+A3G (open triangles).

