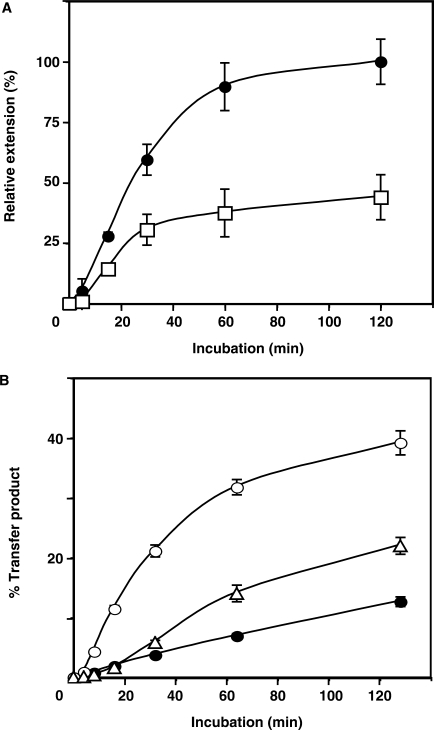
Figure 6.
Effect of A3G on PPT initiation and plus-strand transfer. (A) Time course of PPT-primed plus-strand DNA synthesis. The 15-nt PPT RNA was heat-annealed to a 35-nt minus-strand DNA template and was then extended by HIV-1 RT. The 20-nt DNA product was internally labeled with [α-32P]dCTP in the absence (filled circles) and presence (open squares) of A3G (80 nM). The amount of 20-nt DNA was plotted as Relative Extension (%) versus Time (min), where 100% represents the end point value for the ‘no A3G’ reaction. (B) Time course of plus-strand transfer. The percentage of 80-nt plus-strand DNA product was calculated as described in the legend to Figure 5D. Symbols: no NC/no A3G (filled circles); +NC/no A3G (open circles); and +NC/+A3G (open triangles).

