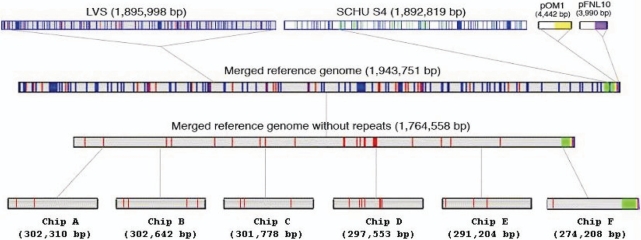
Figure 5.
Schematic representation of whole genome resequencing array set design. Blue vertical lines indicate repeats in the genomes. Unique sequences for LVS and SCHU S4 are shown as red and green vertical lines, respectively. Similarly, yellow and purple vertical lines represent unique sequences from plasmids pOM1 and pFNL10, respectively.

