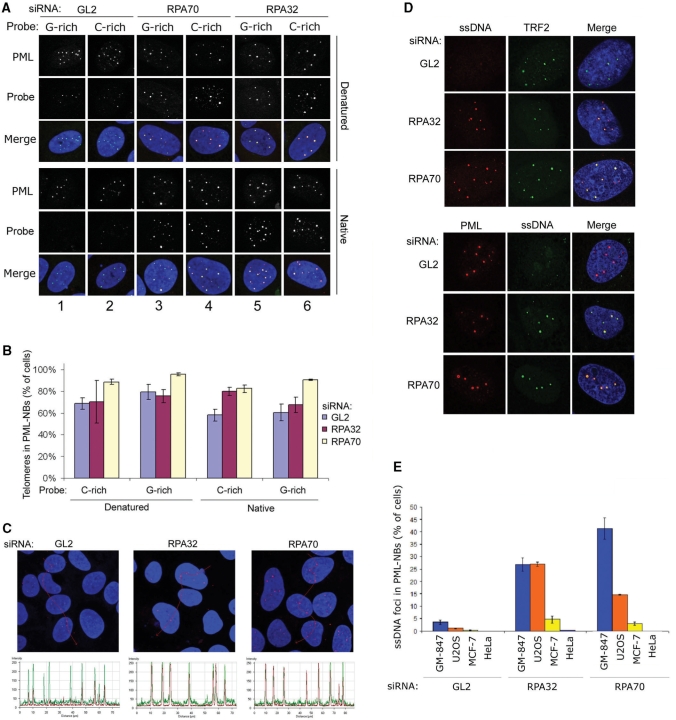
Figure 5.
APBs accumulate ssDNA in response to RPA loss. (A) FISH analysis showing colocalization of telomeres and PML-NBs in U2OS cells transfected with control siRNAs (GL2) and siRNAs against RPA32 and RPA70. Cells were hybridized under native and denaturing conditions, with either a G-rich ([TTAGGG]3) or a C-rich ([CCCTAA]3) telomeric probe. (B) Quantification of U2OS cells containing detectable telomeric signals that colocalize with PML-NBs. Cells containing one or more telomeric signal that colocalize with a PML-NB were scored. For each sample between 70 and 80 cells were examined. Data represent two independent experiments ± SD. (C) Fluorescence intensity diagram of telomeric DNA and PML in siRNA-transfected cells. Red (telomeric DNA), green (PML) and blue (DAPI) is overlaid in each of the images. The intensity diagrams shown in the lower panels are plotted against the red line shown in the upper panels. Telomere signal is represented by red curves and PML signal is represented by green curves. The example shows U2OS cells hybridized using a C-rich probe at native conditions. The complete figure showing all of the hybridization conditions is shown in Supplementary Figure S5. (D) Visualization of single-stranded DNA in control-depleted or RPA-depleted U2OS cells using anti-BrdU antibodies in combination with anti-TRF2 (upper panels) or anti-PML (lower panels). (E) Quantification of ssDNA foci that colocalize with PML-NBs in control-transfected cells (GL2) and cells transfected with RPA32- and RPA70-specific siRNAs. Cells containing one or more distinct ssDNA foci within a PML-NB were scored. For each sample 600 to 800 cells were examined. Data represent two independent experiments ± SD.

