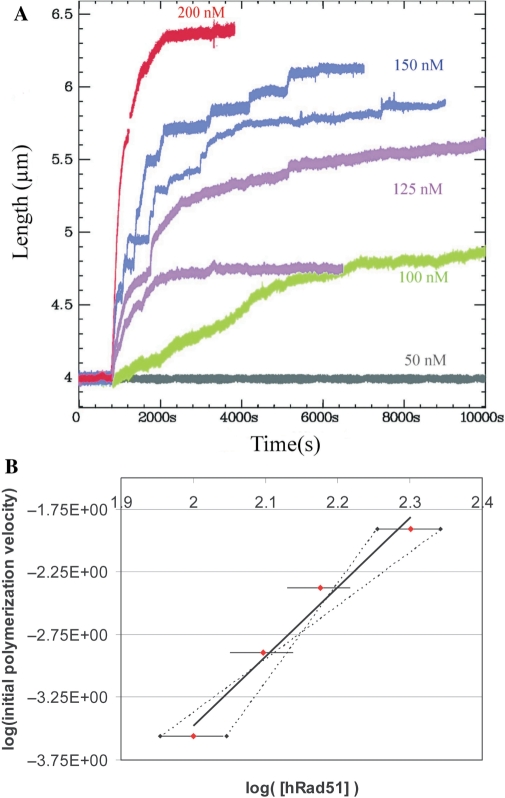
Figure 3.
The effect of hRad1 protein concentration on the formation of the nucleoprotein filament. (A) Polymerization on unconstrained dsDNA at 6 pN applied force in buffer A containing100 µM ATP and different concentrations of hRad51 : 50 nM hRad51 (grey); 100 nM hRad51 (green); 125 nM hRad51 (magenta); 150 nM hRad51 (blue) and 200 nM hRad51 (red). Data obtained under the same experimental conditions are represented with the same colour. (B) hRad51 concentration versus the initial slope of the curves shown in (A). The black straight line is a linear fit of the experimental data. The dotted lines represent the minimum and maximum slopes of the linear fit.

