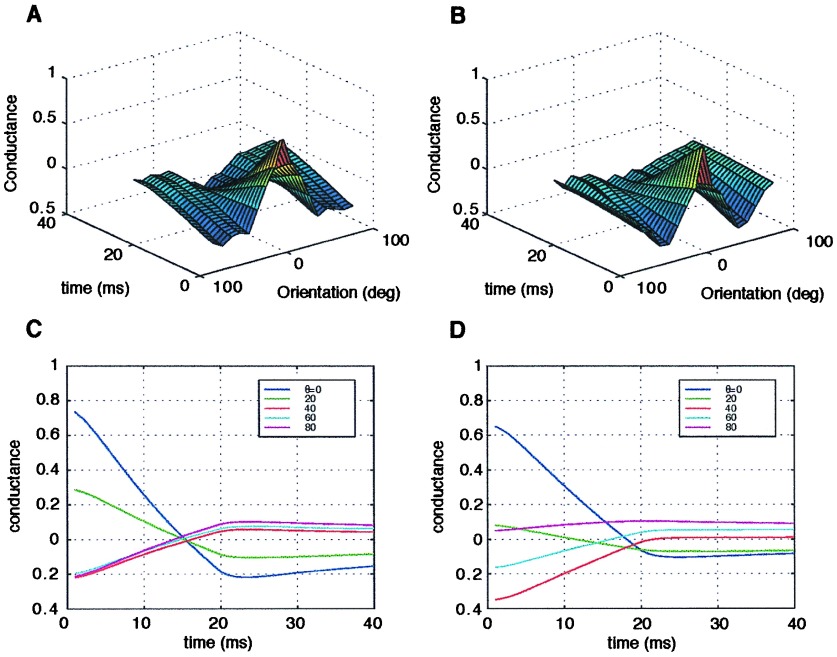
Figure 4.
Reverse correlation functions (kernels) for the two models. (A) Kernel for the PR model. (B) Kernel for the SE model. Both kernels are extracted from stimuli presented at 50 Hz. C and D are cross-sections taken from A and B at different orientations, respectively. Zero-crossings (the time at which the value of the kernel is zero) vary with orientation for the PR model but are constant in the SE model.

