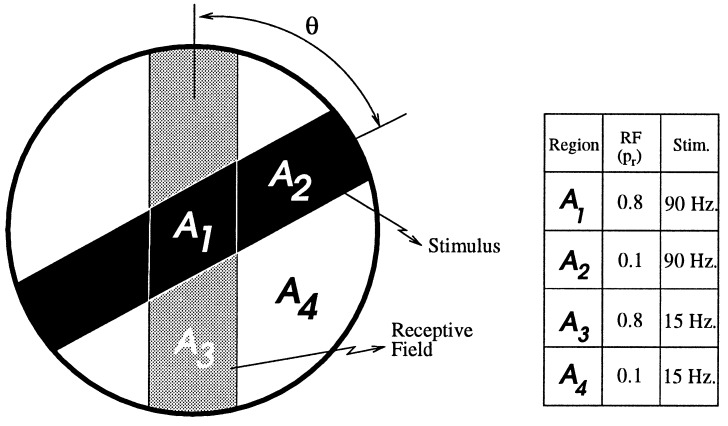
Figure 6.
A simple four-synapse model using probability of release (or efficacy) to define the receptive field. There are four distinct regions as shown, A1, A2, A3, and A4 where the respective properties of synapses are shown in the table. The respective areas are a function of the relative angle between the RF and the stimulus.

