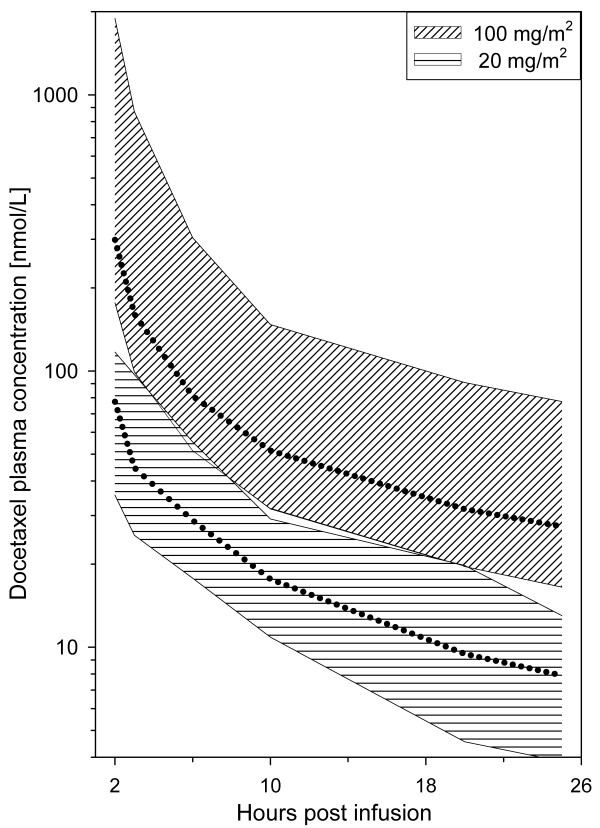
Figure 4.
Interpatient variations for two docetaxel dose levels. Plotting the total range (dotted line = median) of docetaxel concentrations at each time point, the graphs for the patients receiving 20 mg/m2 and the patients receiving 100 mg/m2 will overlap at some time points (e.g. at 6 h: low dose range 18–55 nM, high dose range 51–304 nM). For simplicity, the graph shows determinations from 2 to 25 hours.

