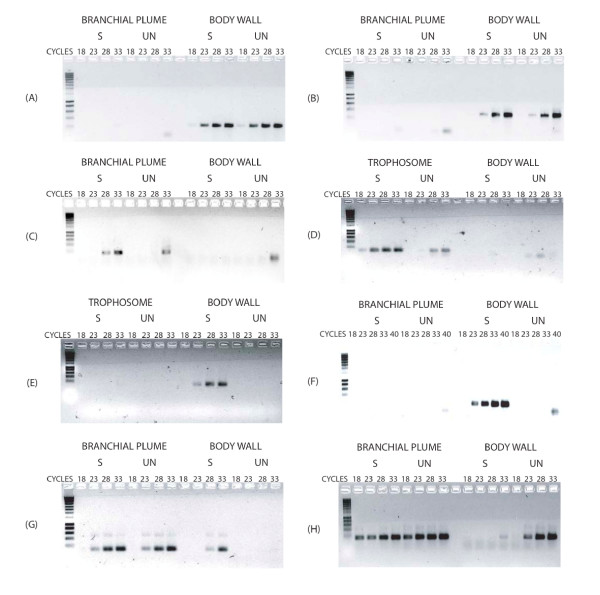
Figure 2.
Typical PCR profiles obtained after amplification of fragments of interesting cDNAs. S = subtracted sample; UN = unsubtracted sample. (A) and (B) Abundant tissue-specific transcripts: exosqueleton β-chitin-binding transcript (A) and galaxin transcript (B). (C) and (D) Transcripts enriched after SSH procedure: chitinase precursor transcript (C) and RpCAtr (D). (E) and (F) Rare transcripts enriched after SSH procedure: RpCAbr transcript (E) and intracellular globin transcript (F). (G) Abundant transcript in one tissue and rare in other tissue: MVP transcript. (H) Non equally subtracted transcript: cytochrome c oxidase subunit I transcript. The faint bands appearing at a smaller size than expected in some wells are interpreted as non-specific amplification (possible primer dimerization under specific conditions).

