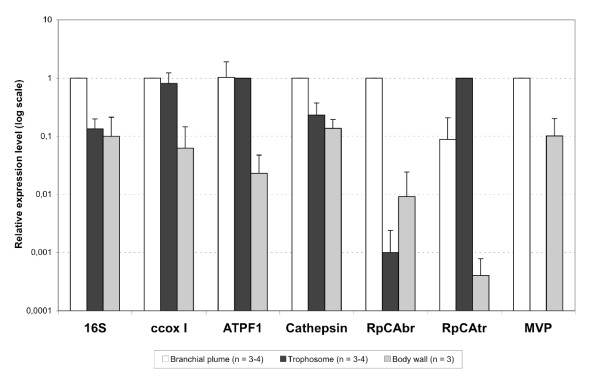
Figure 3.
Relative expression levels of ribosomal RNA 16S, ccox I, ATPF1, Cathepsin, RpCAbr, RpCAtr, and MVP transcripts in the branchial plume, trophosome and body wall tissues. For each transcript, the calibrator tissue was chosen as the tissue with the higher expression: the branchial plume was the calibrator for ribosomal RNA 16S, ccox I, Cathepsin, RpCAbr and MVP amplifications, the trophosome was the calibrator for RpCAtr and ATPF1 amplifications. The number of tissue replicates (n) ranges from 3 to 4, and corresponds to the number of intra-individual tissue pairs we had.

