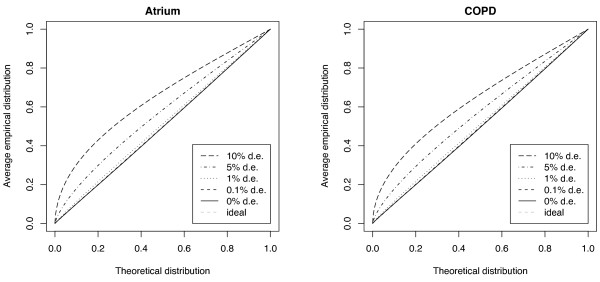
Figure 6.
Average empirical p-value distribution for WAME under regulation. Average empirical p-value distribution of the unregulated genes, calculated using WAME, when 0%, 0.1%, 1%, 5% and 10% of the genes have a log2 differential expression of 1, i.e. a two-fold change. When genes are regulated the estimate of Σ is biased, leading to conservative, non-diagonal curves.

