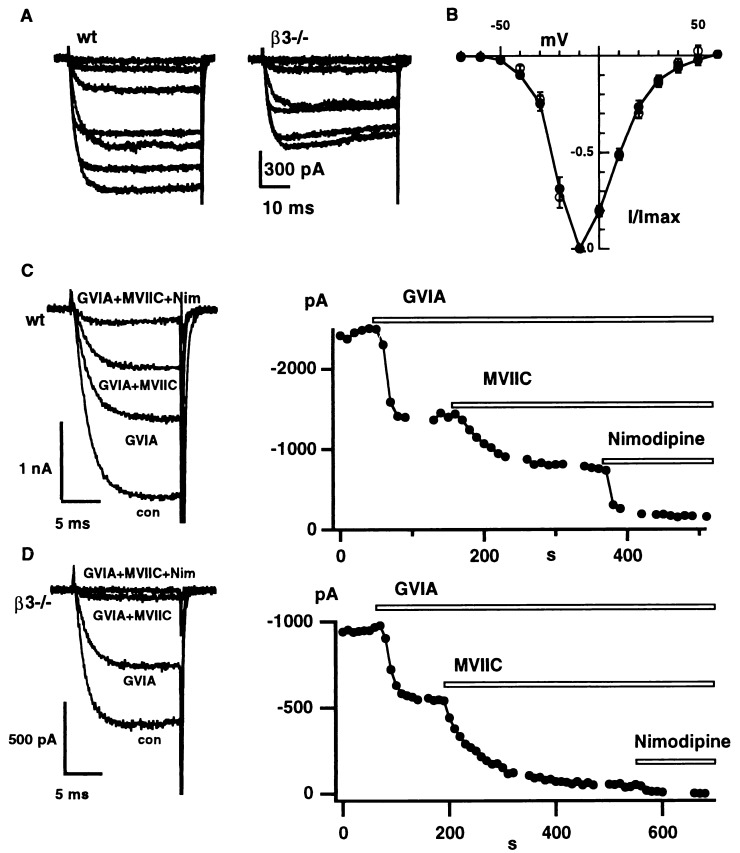
Figure 2.
The voltage dependence and pharmacological dissection of Ca2+ channel currents in wt and β3−/− SCG neurons. (A) Examplar current records of IBa taken from a wt neuron and a β3−/− (mut) neuron. Depolarizations from −90 mV to levels ranging between −50 and 10 mV in 10 mV increments. (B) The current voltage plot (mean ± SE) normalized to the peak current at −10 mV for eight wt neurons (closed circles) and seven β3−/− neurons (open circles). (C and D) The response of peak IBa in wt (C) and β3−/− (D) neurons to application of 1 μM ω-conotoxin GVIA, 10 μM ω-CTx-MVIIC, and 10 μM nimodipine. IBa was activated by depolarizations from −80 mV to −10 mV every 10 s. Representative current traces are shown on the left.

