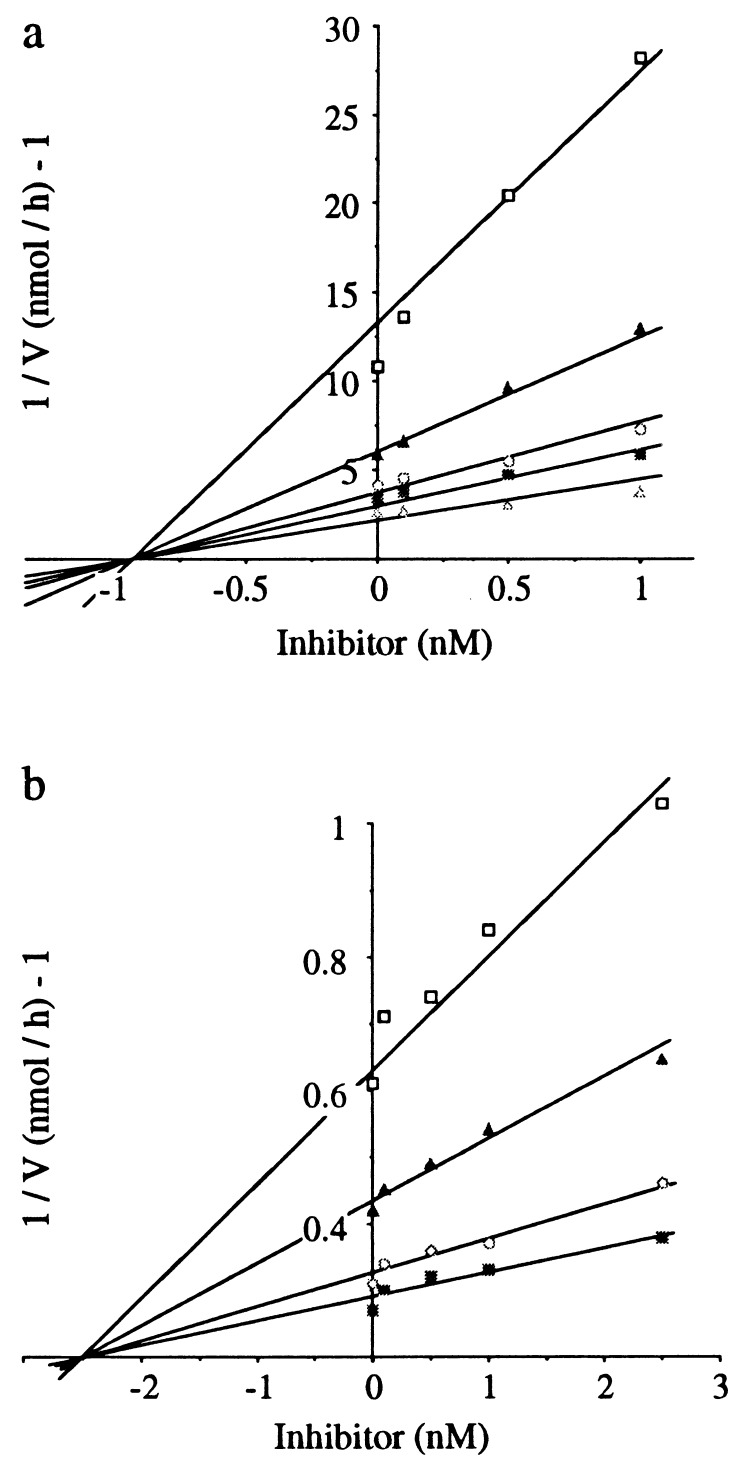
Figure 3.
Dixon plot analysis of the inhibitory activity of compound 9B for NEP and APN. The experiments were performed at 25°C in 50 mM Tris⋅HCl buffer (pH 7.4). (a) The inhibitory potency of 9B for NEP was measured by using DGNPA as substrate at the concentrations indicated (□, 5μm; ▴, 10 μM; ○, 25 μM; ■, 50 μM; ▵, 100 μM). (b) The inhibitory potency of 9B for APN was measured by using Ala-PNA as substrate at the concentrations indicated (□, 25 μM; ▴, 50 μM; ○, 100 μM; ■, 200 μM). Each point of the Dixon plots represents the mean of triplicate determinations. These experiments were repeated five times, leading to a mean Ki value (± SEM) of 0.80 ± 0.05 nM for NEP and 2.5 ± 0.3 nM for APN.

