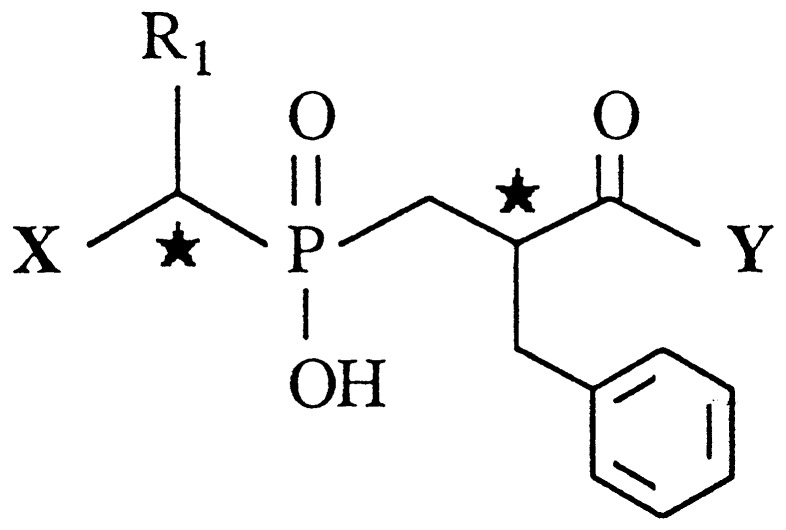
Table 1.
Inhibitory potencies of phosphinic derivatives containing various R1 residues for NEP and APN

| Compound | X | R1 | Y |
Ki
(nM)*
|
|
|---|---|---|---|---|---|
| NEP† | APN‡ | ||||
| 3(A + B) | NH2 | CH2Ph | (S)Phe | 190 ± 50 | 2.9 ± 0.8 |
| (C + D) | 7,000 ± 900 | 200 ± 40 | |||
| 4(A + B) | NH2 | Ph | (S)Phe | 104 ± 7 | 3.8 ± 0.2 |
| (C + D) | 32,000 ± 1,000 | 320 ± 10 | |||
| 5(A + B) | NH2 | CH3 | (S)Phe | 146 ± 2 | 2.2 ± 0.2 |
| (C + D) | 35,000 ± 1,000 | 670 ± 90 | |||
| 10§ | H | CH2Ph | (S)Phe | 100 ± 7 | >100,000 |
| 11¶ | NH2 | CH2Ph | H | 1,000,000 | 370 ± 80 |
Values are the mean ± SEM from three independent experiments performed in triplicate of five inhibitor concentrations.
NEP activity was measured by using DGNPA as substrate.
APN activity was measured by using Ala-p. NA as substrate.
Compound 10 is a mixture of two stereoisomers.
Compound 11 is a mixture of four stereoisomers.
