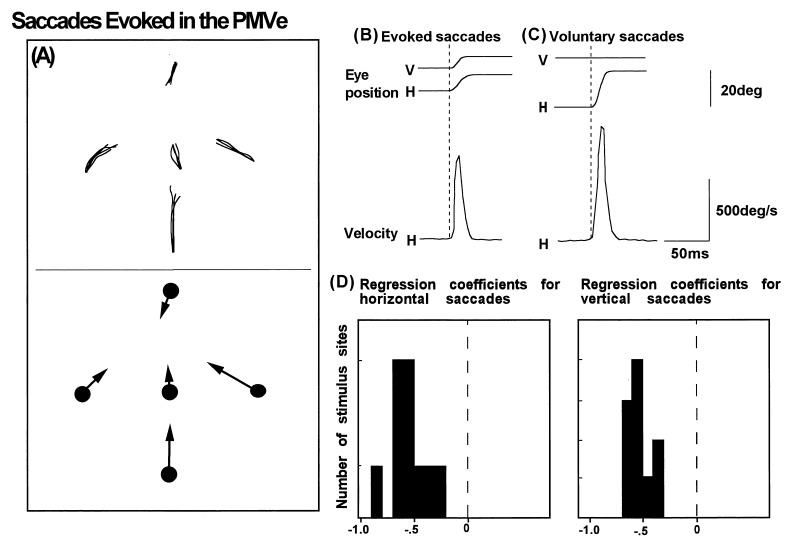
Figure 2.
(A) Trajectories of saccades (Upper) and their mean vectors (Lower) from five different fixation points, evoked by stimulation of the PMVe. (B and C) Averaged traces of eye position (Upper) and velocity (Lower) observed in representative examples of electrically evoked (B) and voluntary (C) saccades. (D) The distribution of regression coefficients calculated from correlation plots of eye position and the amplitudes of horizontal and vertical saccades. The mean horizontal and vertical correlation coefficients and SD are −0.44 ± 0.12 and −0.56 ± 0.17, with a grand mean of −0.47 ± 0.21.

