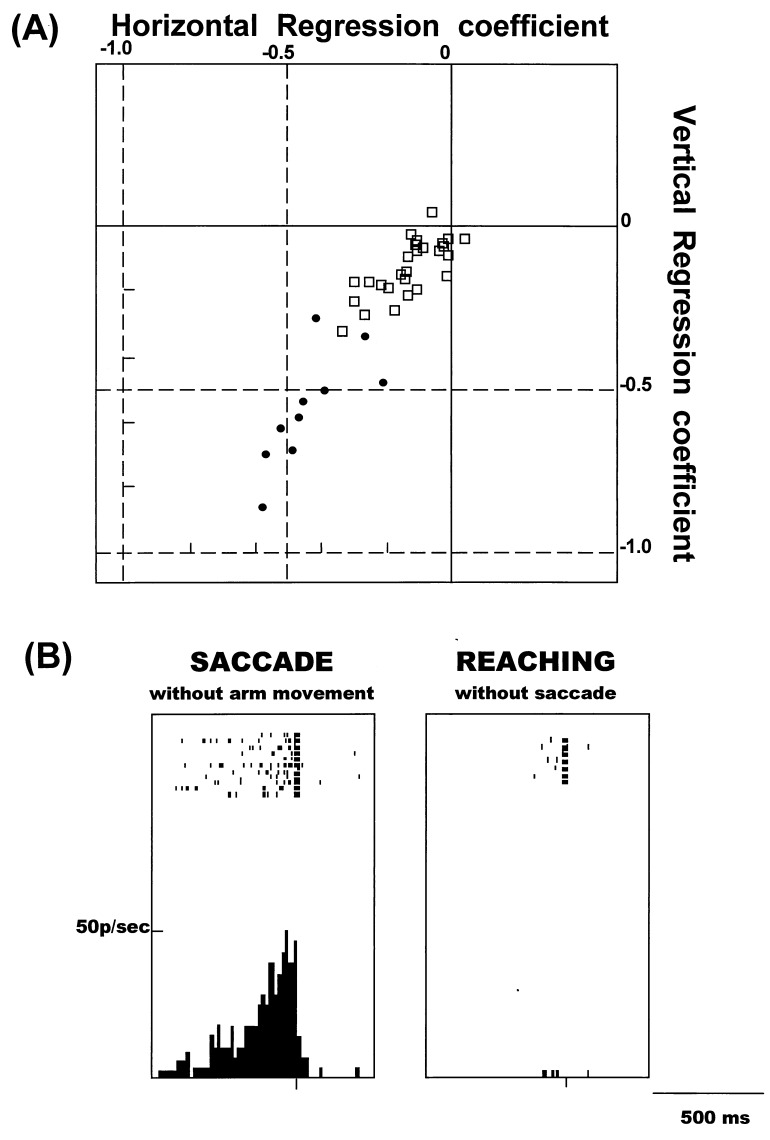
Figure 3.
(A) Scatter plot of the horizontal and vertical regression coefficients calculated from saccades evoked in the PMVe and FEF. □, Coefficients in the FEF. •, Coefficients in the PMVe. (B) Discharges of a cell in the PMVe while the monkey was performing the saccade task (Left) and arm-reaching task (Right). Discharges, shown as short vertical bars, are aligned with the onset of either saccades or reaching movements.

