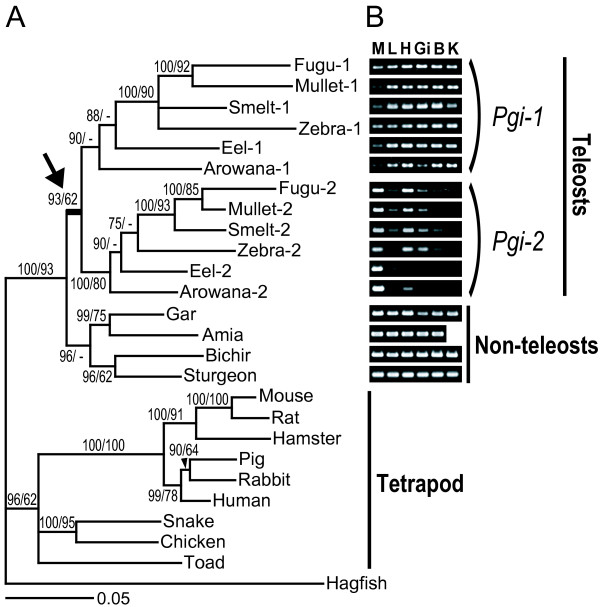
Figure 1.
Molecular phylogeny and spatial expression patterns of Pgi. (A) Bayesian tree of Pgi genes derived from 20 vertebrates. Numbers indicate percent posterior probabilities for the Bayesian tree (left) and bootstrap support values by the maximum likelihood method (right). Arrow denotes a gene duplication event. In cDNA clones, only one Pgi was identified from non-teleosts, whereas two Pgi genes were identified from teleosts. The two Pgi genes differed by about 20% in amino acid sequence, and were grouped into separate clades (Pgi-1 and Pgi-2). In both clades, the gene relationships were consistent with the evolutionary relationships of teleost species [18, 19, 21]. (B) Partial-length gel images of the RT-PCR expression analysis of Pgi genes and positive control (β-actin) genes in ray-finned fishes. The tree in the left panel shows the relationships among the Pgi genes inferred in this study. The black circle on the tree denotes the timing of the Pgi gene duplication event. Letters indicate tissues: M, muscle; L, liver; H, heart; Gi, gill; B, brain; K, kidney. Full-length gels, including negative controls and size markers, are presented in Additional file 1: Fig. S5.

