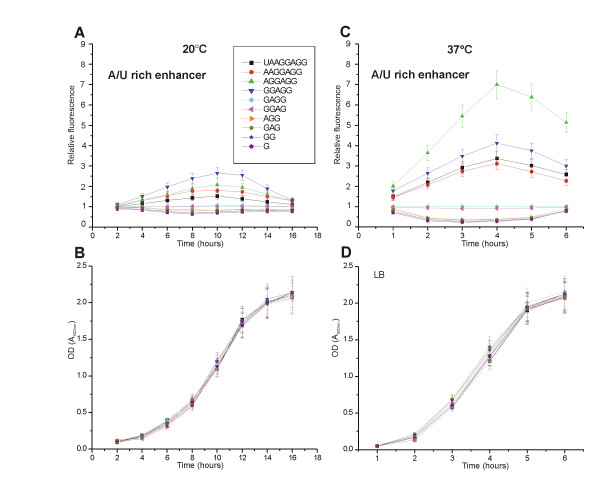
Figure 3.
Effect of the growth temperature on TIR selection. The cells were grown either at 20°C (A) or at 37°C (C). All the TIRs shown contain strong, A/U-rich enhancers. The bacterial cultures were inoculated and aliquots were taken at the indicated time points. GFP expression was induced in these aliquots for one hour and the fluorescence was measured. Relative fluorescence was calculated by dividing the fluorescence values measured for cells containing particular constructs by the fluorescence measured for the GAGG SD sequence. In addition, growth curves at 20°C (B) and 37°C (D) are shown.

