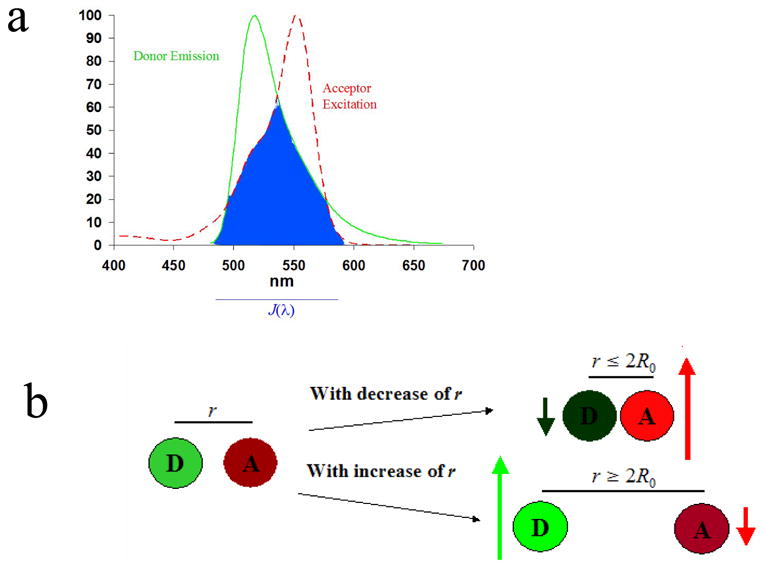
Figure 1.1. Indications for and Observations During FRET.

1.1a: Conditions required for FRET: overlap of the emission spectrum of the donor (“D”) and excitation spectrum of the acceptor (“A”) described by overlap interval J(λ). The overlap integral shown is for the fluorescein-rhodamine pair. 1.1b: Qualitative results of FRET are shown: as the distance r separating the donor and acceptor is decreased, the relative emission of the donor decreases while the emission of the acceptor increases.
