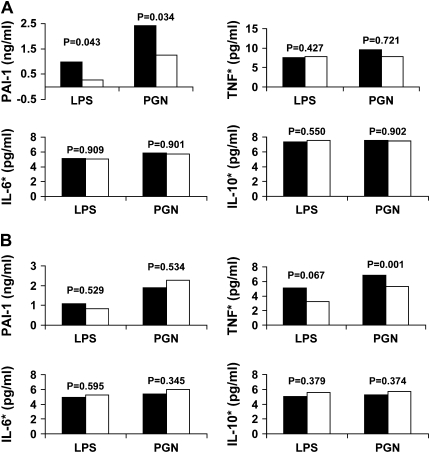
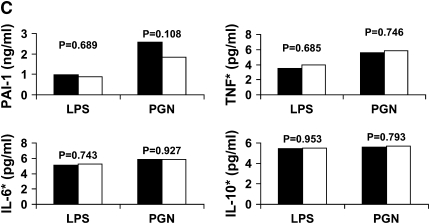
Figure 2.
Changes in plasminogen activator inhibitor (PAI)-1, tumor necrosis factor (TNF), IL-6, and IL-10 concentrations after ex vivo whole blood stimulation with lipopolysaccharide (LPS) and peptidoglycan (PGN) for PAI4G,5G (A), PAI2846 (B), and PAI7343 (C) genotypes. Values for TNF, IL-6, and IL-10 are log converted. PAI4G,5G and PAI7343 genotype data were missing for two subjects and one subject. *Log-converted cytokine concentrations. (A) Solid bars, 4G/4G, 4G/5G (n = 16); open bars, 5G/5G (n = 5). (B) Solid bars, AG, AA (n = 4); open bars, GG (n = 19). (C) Solid bars, AA (n = 14); open bars AG or GG (n = 8).


