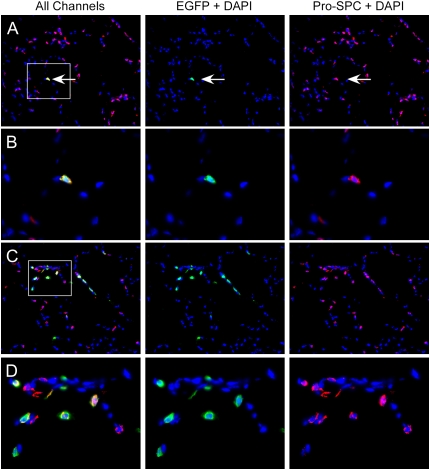
Figure 6.
Immunofluorescence analysis of lung tissue for EGFP transgene expression after intratracheal delivery of CCL-SPC-EGFP lentiviral supernatant to mice. Cryosections were immunostained for EGFP (green) and pro-SPC (red) and nuclei were counterstained with DAPI (blue). In A, the arrow shows a cell double positive for pro-SPC and EGFP immunostaining (×200). B is a higher magnification (×640) of the boxed area from A. C shows an example of an alveolar region that had a high level of AECII transduction and EGFP expression (×200). D shows a higher magnification of the boxed area in C (×640). All images are shown with all colors merged on the left panel (All Channels), and with each single immunostained color with DAPI to the right of the merged image.

